#BeAWomanInDataViz Tableau Workshop
I haven't felt compelled to write on this blog in some time, partly out of time and partly out having something worth sharing. But I went to the #BeAWomanInDataViz workshop on Saturday, so now I do!
The workshop was run by Data + Women London, with kind hosting from The Information Lab's Data School and assistance from Tableau itself. I was initially somewhat uncertain about making the trip to Cannon Street at 8am on a Saturday morning (it had been a somewhat late one the night before) and this skepticism was exacerbated by three of my colleagues taking a fruitless trip to Google two weeks ago, hoping for some Cloud training but forgetting the Free Lunch rule (they left after the lunch), but hey, this was the first Meetup I had ever signed up to and I wanted a proper introduction to Tableau.
The venue was easy enough to find near Mansion House and there was a coffee and fruit based greeting, along with a quick introduction to all the collaborating parties. Then - straight to it, with Sophie Sparkes hosting the session in my room. Everyone had got the memo about downloading and signing up to Tableau Public beforehand so it was straight into loading data, creating a heat map and a map and assembling them into a dashboard, in two hours.
It was cycle hire data which meant it felt a bit like being at work, but here's mine below;
After lunch (including a brief walk to clear my head in which I spotted some very lost Scouts), the groups were then divided by lottery into two rooms to work on problems in a much more free-form way for a bit longer (2.5 - 3 hours). My room worked on a Spotify dataset of track streaming information for the whole of 2017, led by two Tableau-ers, Geraldine and Paulien. The other room worked on lending data from Kiva, the microfinance company (which I would like to take a look at myself soon!). This session also included a bit about how to think about and approach problem solving with visualisations, which I found valuable and an important thing to include. Eventually, I decided that my Spotify problem would be to understand what the (Spotify) world was listening to on your birthday (mine was not a great vintage), as per the below;
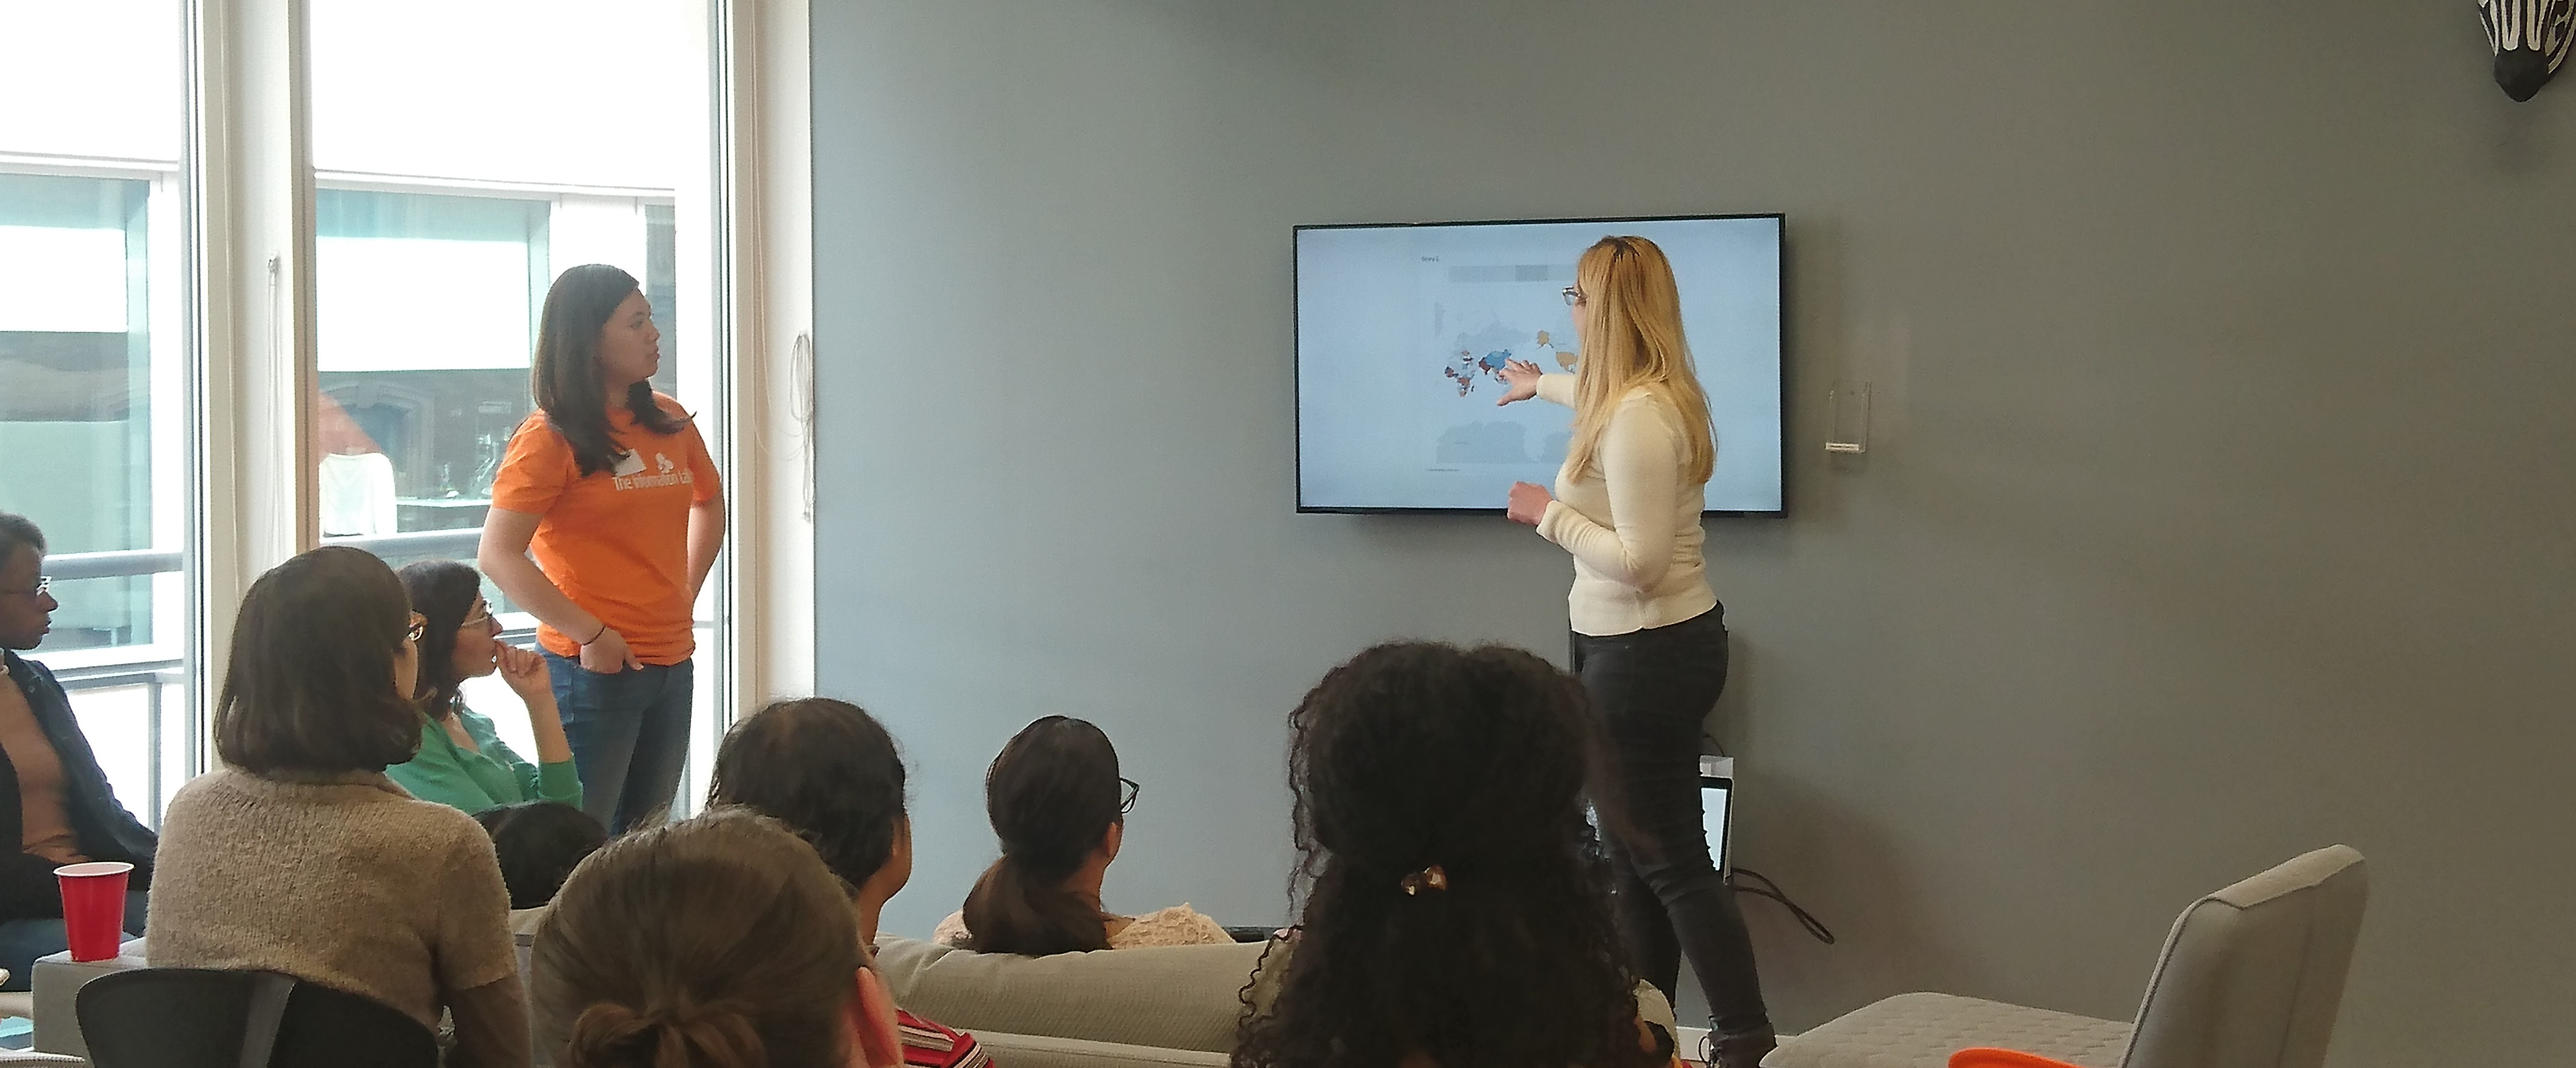
From this second session, a call was put out for some quick presentations to show people what they had found from the data, of which the majority were from the Kiva room (as per the featured image in this post). Since it was a data + women event many of those in the room looked at the gender distribution of the Kiva lending data with some very interesting results, which I will fish out of Tableau public and post on Twitter this week.
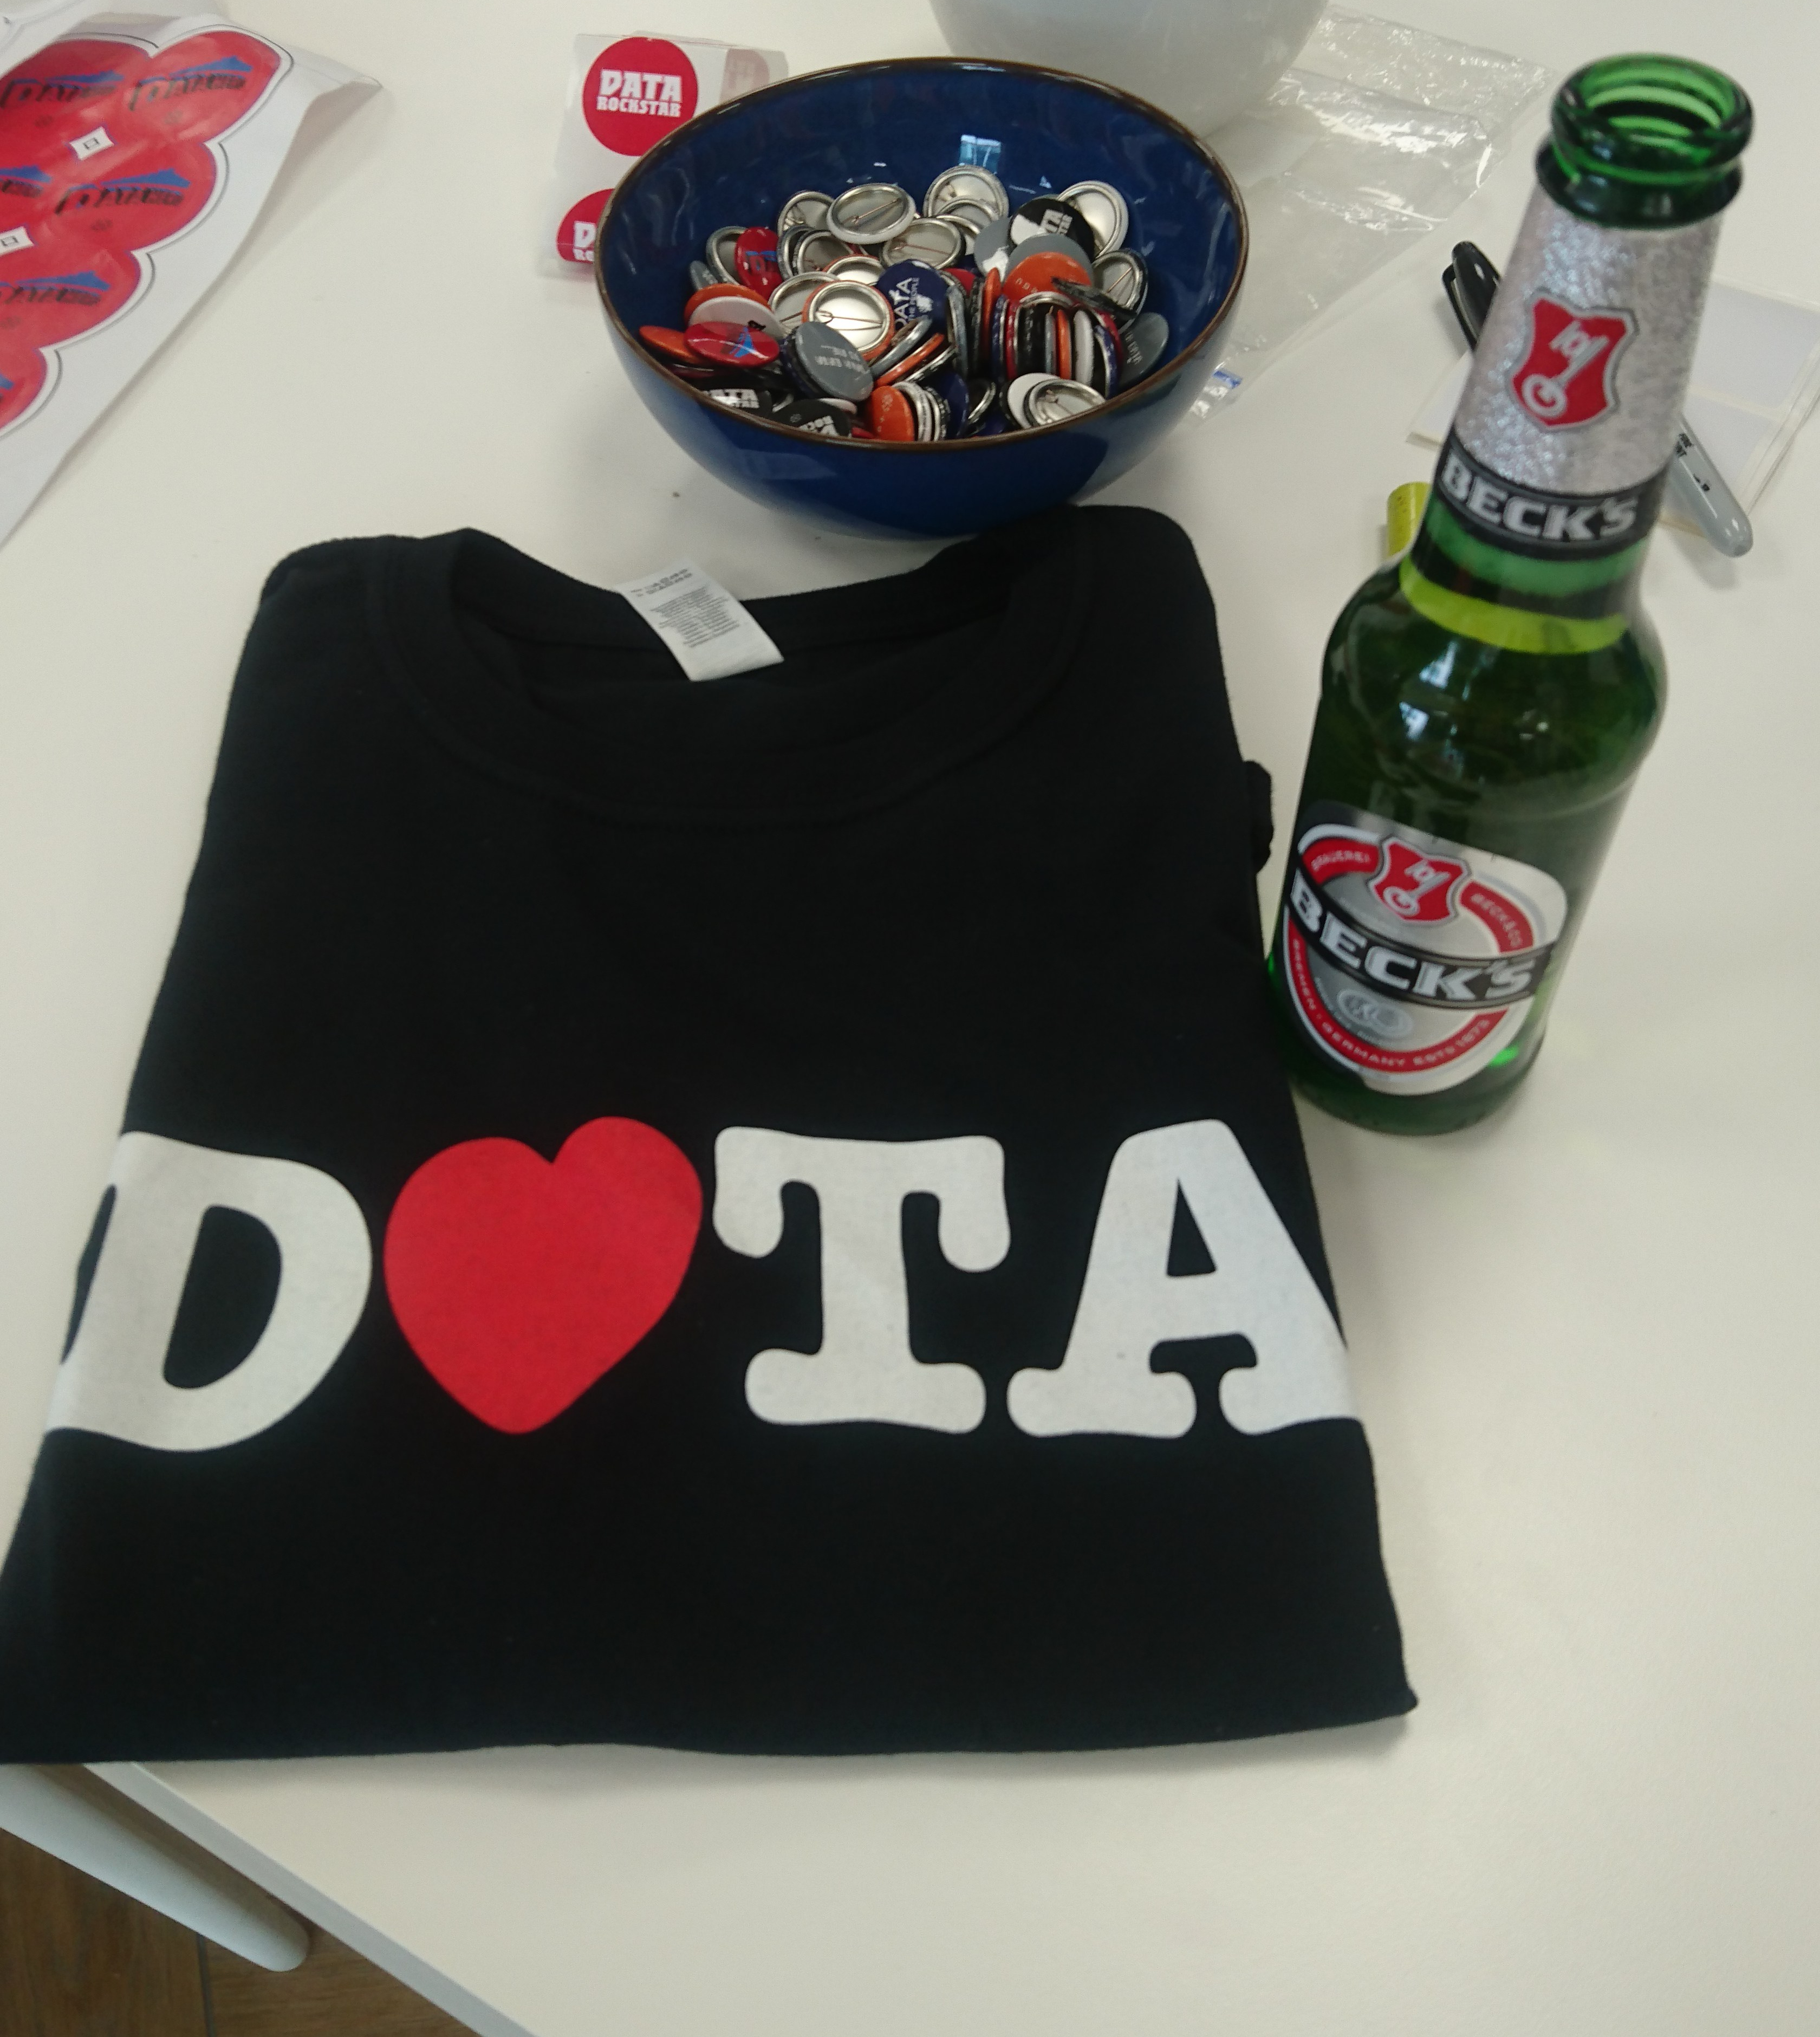
The closing session in the breakout area was a wrap up of Tableau in general and what the Data School at The Information Lab offers, but also a surprise T-shirt competition based on who had tweeted the most using their hashtag for the day (which was being followed live on a Tableau dashboard, of course). Since I decided to put my passionate hat back on, I was one of those who was tweeting about the event, and I won one of the shirts! I was also handed a beer quite promptly and thus began some networking afterwards, which I was actually pretty pleased with (as usually I'm not the greatest fan of networking). I stepped out of the offices again at half five actually quite buzzing, and that's the most productive Saturday I have had for a while.
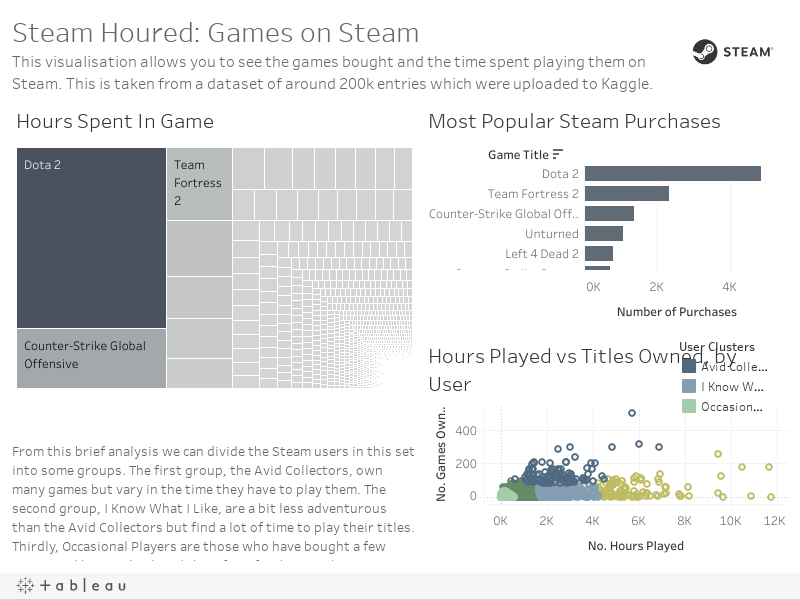
However, they say you only really learn something when it gives you the passion to pick it up without someone lurching over your shoulder and telling you to do it, which I have felt since I left the session (have a Tableau Public Profile, might as well use it). In honour of my winning T shirt which reminds me of the game DOTA, my third visualisation is one of Steam player data, drawn from a dataset which was uploaded to Kaggle last year.
No, I am not the person who has spent just under twelve thousand hours in Civ V (which is about 70 WEEKS of playing). Thanks to Data + Women and The Data School at the Information Lab, I will be sharing more from Tableau in the future!