My First Week using Alteryx
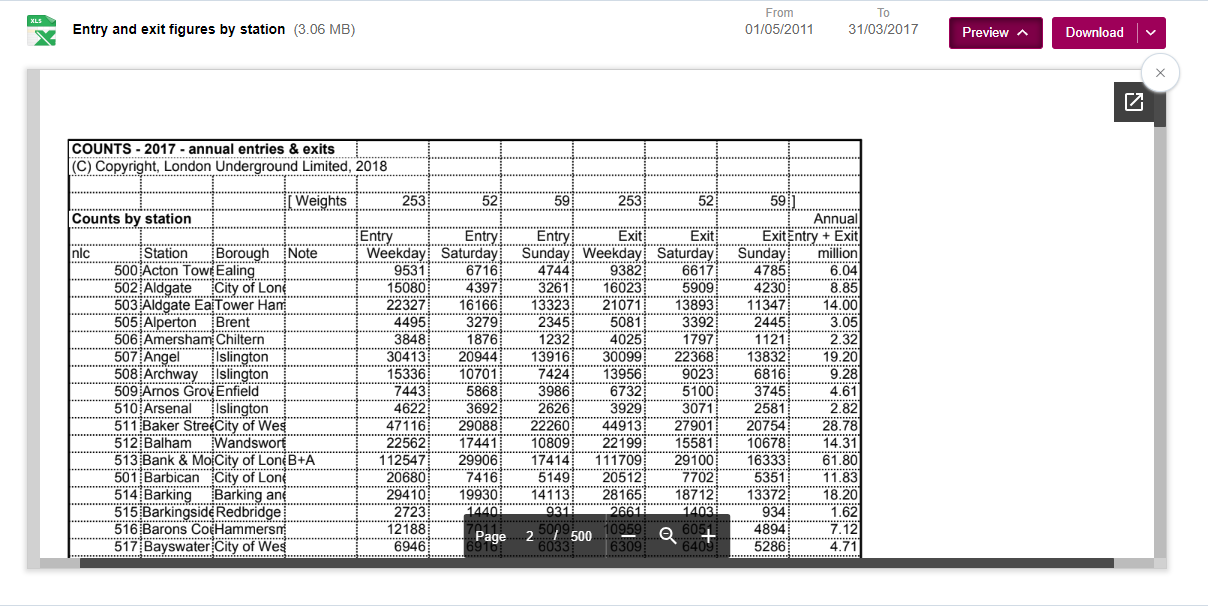
You're not really meant to say this when you are (or have been) a data analyst/scientist/whatever, but I have a limited patience/tolerance for the reformatting and cleaning of data. Unlike most other pursuits, where you clean up afterwards, data science and visualisation tend to make you clean up before, during and after whatever you're trying to investigate or show. The thought of shaping a data set into something useful by blending new data or calculated statistics with it is fun for most people; the thought of spending ages reformatting data-sets which have come out of PDFs or dodgy internal BOXI reports appeals to no one.
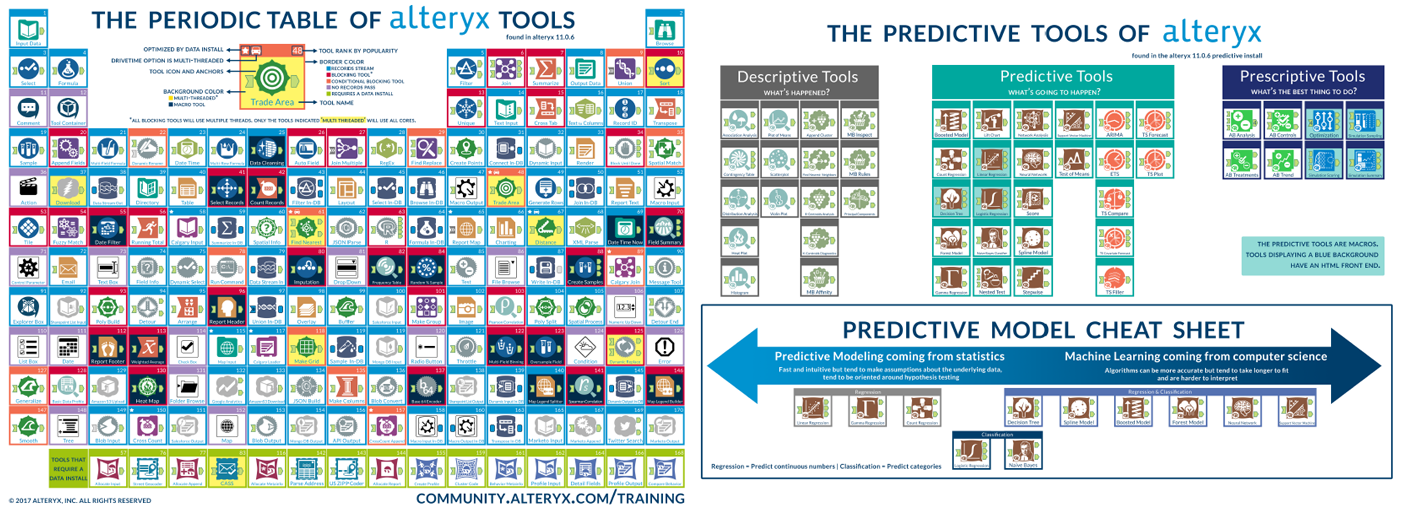
I've started a new role recently which uses Alteryx to do this preprocessing in advance of visualisations made in Tableau. Being reasonably familiar with R, I was quite intrigued by a tool which might iron this crummy stage out a bit, or, perhaps better, make it actually intelligible to other people looking at your work (sorry all those dodgy R coders out there who don't write proper markdown).
Alteryx uses a work/process flow type interface to allow the user to structure and order palettes of manipulation tools, categorised by general sort of thing you're trying to do. This makes it easy to see at a glance the direction of the manipulation you're doing, as the clusters indicate patches of work along similar themes (except blue, which can and does seem to be thrown in every where).
After loading it, it didn't take as long as I thought to acclimatise to its interface. This might be because I'm used to a type of IDE-ish interface but others in my class without that background also seemed to get into it fairly quickly. Working with the tools and sequencing them together, the barrier to entry seemed to be lower than something like R, which hits you in the face with its fiddliness and particularities very quickly. That's not to say it's flawless - while in the paddling pool of the tool at the moment, rerunning flows repeatedly isn't a big deal, but running only particular operations isn't possible, as the only kind of sectioning is available through using containers.
However, having been one of those people stitching together massive tables which were pulled, in pieces, out of giant PDFs in Tabula, I'm looking forward to automating a lot of that tedium and getting on with the actual fun parts of analysis.